
Hottest in 125,000 Years? Dishonest Claim Contradicts the Evidence
/Amidst the hysterical hype in the mainstream media about recent heat waves all over the Northern Hemisphere, especially in the U.S., the Mediterranean and Asia, one claim stands out as utterly ridiculous – which is that temperatures were the highest the world has seen in 125,000 years, since the interglacial period between the last two ice ages.
But the claim, repeated mindlessly by newspapers, magazines and TV networks in lockstep, is blatantly wrong. Aside from the media confusing the temperature of the hotter ground with that of the air above, there is ample evidence that the earth’s climate has been as warm or warmer than today’s – and comparable to that 125,000 years ago – several times during the past 11,000 years after the last ice age ended.
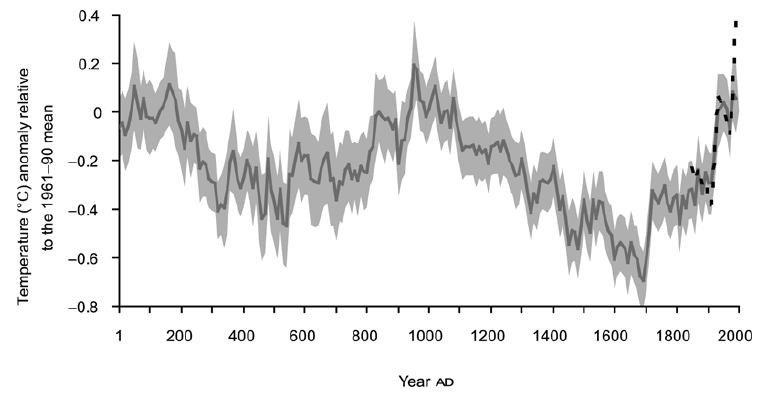
Underlying the preposterous claim is an erroneous temperature graph featured in the 2021 Sixth Assessment Report of the IPCC (Intergovernmental Panel on Climate Change). The report revives the infamous “hockey stick” – a reconstructed temperature graph for the past 2020 years resembling the shaft and blade of a hockey stick on its side, with no change or a slight decline in temperature for the first 1900 years, followed by a sudden, rapid upturn during the most recent 120 years.

Prominently displayed near the beginning of the report, the IPCC’s latest version of the hockey stick is shown in the figure above. The solid grey line from 1 to 2000 is a reconstruction of global surface temperature from paleoclimate archives, while the solid black line from 1850 to 2020 represents direct observations. Both are relative to the 1850–1900 mean and averaged by decade.
But what is missing from the spurious hockey stick are two previously well-documented features of our past climate: the MWP (Medieval Warm Period) around the year 1000, a time when warmer than normal conditions were reported in many parts of the world, and the cool period centered around 1650 known as the LIA (Little Ice Age).
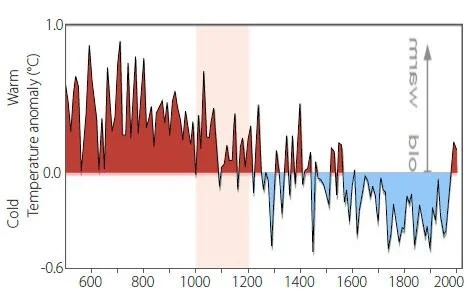
The two features are clearly visible in a different reconstruction of past temperatures by Fredrik Ljungqvist, who is a professor of geography at Stockholm University in Sweden. Ljungqvist’s 2010 reconstruction, for extra-tropical latitudes (30–90°N) in the Northern Hemisphere only, is depicted in the next figure; temperatures are averaged by decade. Not only do the MWP and LIA stand out, but the end of the Roman Warm Period at the beginning of the previous millennium can also be seen on the left.
Both this reconstruction and the IPCC’s are based on paleoclimate proxies such as tree rings, marine sediments, ice cores, boreholes and leaf fossils. Although other reconstructions have supported the IPCC position that the MWP and LIA did not exist, a large number also provide strong evidence that they were real.
A 2016 summary paper by Ljungqvist and a co-author found that of the 16 large-scale reconstructions they studied, 7 had their warmest year during the MWP and 9 in the 20th century. The overall choice of research papers that the IPCC’s report drew from is strongly biased toward the lack of both the MWP and LIA, and many of the temperature reconstructions cited in the report are faulty because they rely on cherry-picked or incomplete proxy data.
A Southern Hemisphere example is shown in the figure below, depicting reconstructed temperatures for the continent of Antarctica back to the year 500. This also reveals a distinct LIA and what appears to be an extended MWP at the South Pole.
The hockey stick, the creation of climate scientist and IPCC author Michael Mann, first appeared in the IPCC’s Third Assessment Report in 2001, but was conspicuously absent from the fourth and fifth reports. It disappeared after its 2003 debunking by mining analyst Stephen McIntyre and economist Ross McKitrick, who found that the graph was based on faulty statistical analysis, as well as preferential data selection (see here and here). The hockey stick was also discredited by a team of scientists and statisticians assembled by the U.S. National Academy of Sciences.
Plenty of evidence, including that presented here, shows that global temperatures were not relatively constant for centuries as the hockey stick would have one believe. Maximum temperatures were actually higher than now during the MWP, when Scandinavian Vikings farmed in Greenland and wine was grown in the UK, and then much lower during the LIA, when frost fairs on the UK’s frozen Thames River became a common sight.
In a previous post, I presented evidence for a period even warmer than the MWP immediately following the last ice age, a period known as the Holocene Thermal Maximum.
Next: Record Heat May Be from Natural Sources: El Niño and Water Vapor from 2022 Tonga Eruption


