No Evidence That Weather Extremes Becoming More Frequent or Intense: (6) Wildfires
/This post on wildfires completes the present series on weather extremes. Just as with all the other examples of extreme weather presented in this series, there’s no scientific evidence that wildfires today are any more frequent or severe than anything experienced in the past. Although wildfires can be exacerbated by other weather extremes such as heat waves and drought, we’ve already seen that those extremes are not on the rise either.
Together with tornadoes, wildfires are probably the most fearsome of the weather extremes commonly blamed on global warming. Both can arrive with little or no warning, making it difficult or impossible to flee, are often deadly, and typically destroy hundreds of homes and other structures.
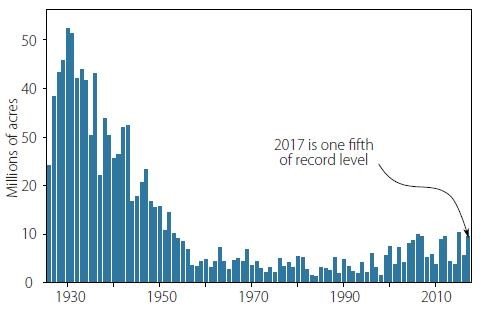
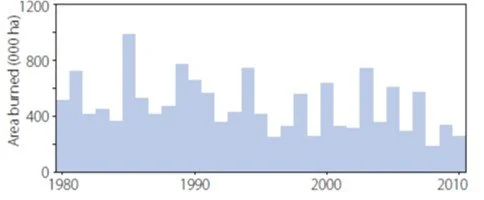
The worst wildfires occur in naturally dry climates such as those in Australia, California or Spain. The next three figures show the annual area burned by wildfires in Australia, the U.S. and the Mediterranean, respectively. Clearly, the area burned annually is declining in all three regions, despite hysterical claims to the contrary by the mainstream media.
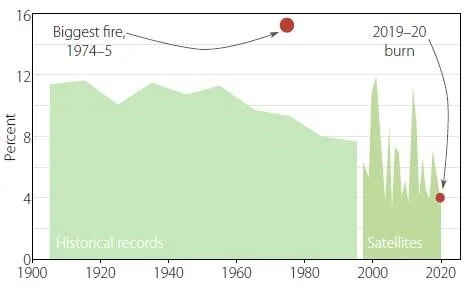
The top figure above presents a recent estimate of the percentage of Australia’s land surface burned every decade from 1900 to 2000, plus actual satellite measurements from 1997 to 2020. Also shown is the 1974-75 bushfire season, when a record total of 117 million hectares (300 million acres) were consumed. The annual average during a 30-year period of global cooling from 1940 to 1970 was about 80 million hectares (200 million acres).
Although the number of acres burned annually in the U.S. (middle figure above) has gone up slightly over the last 25 years or so, the present burned area is still only a small fraction of what it was back in the 1930s. Because modern global warming was barely underway in the 1930s, climate change clearly has nothing to do with the incineration of U.S. forests. The recent uptick reflects the introduction of wildfire suppression that has led to increases in forest density and the buildup of undergrowth, both of which greatly enhance the potential for bigger fires.
The bottom figure above reveals no such uptick in recent Mediterranean wildfires, at least until 2010. This contrast between the Mediterranean and the U.S., where wildfires are becoming fewer but larger in area, has been attributed to different forest management policies on the two sides of the Atlantic – despite the protestations of U.S. politicians and some firefighting officials in western states that climate change is responsible for the recent increase in fire size.
The figure below illustrates the timeline from the year 1600 onward of fire occurrence at more than 800 different sites in western North America.
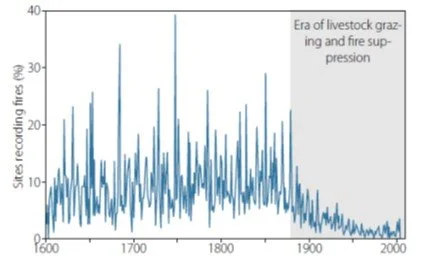
The sudden drop in wildfire occurrence around 1880 has been ascribed to the expansion of American livestock grazing in order to feed a rapidly growing population. The depletion of fuel by grazing cattle, together with the firebreaks created by the arrival of railroads, drastically reduced the incidence of wildfires. And once mechanical equipment for firefighting such as fire engines and aircraft became available in the 20th century, more and more emphasis was placed on wildfire prevention.
Intentional burning, long used by native tribes and early settlers, has become a thing of the past in the U.S. Only now, after several devastating wildfires in California, is the idea of controlled burning being revived. In Europe, on the other hand, prescribed burning has been supported by land managers for many years.
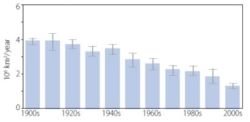
Globally, the wildfire trend is the same as in Australia, the U.S. and the Mediterranean. Wildfires have diminished globally as the planet has warmed, as depicted in the next figure showing the estimated worldwide area burned by wildfires by decade from 1900 to 2010.
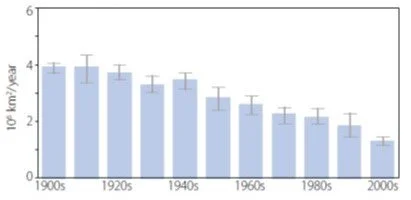
Over the century from 1915 to 2015, the global burned area declined steadily at a rate of approximately 7% per decade, calculated from the data in the figure above and a 2017 study. The study attributes the declining trend to the dominance over higher temperatures of heavier precipitation and increased population density: while warming enhances wildfires by drying out vegetation, population increases lead to a reduction in vegetation through clearing of land.
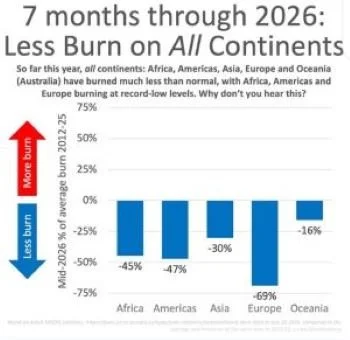
The downward global trend has continued in 2026, in spite of extensive wildfires in southern Europe several months ago:
The ever-rising level of CO2 in the atmosphere would be expected to increase wildfire risk, since CO2 promotes plant growth. The concentration of CO2 in the atmosphere is currently rising by about 2.6 parts per million (ppm) per year and the global average reached 426 ppm in 2025. But at the same time, higher CO2 levels reduce plant transpiration, meaning that plants’ stomata or breathing pores open less, the leaves lose less water and more moisture is retained in the soil. Increased soil moisture has led to a worldwide greening of the planet.
Next: Leading Coral Expert Calls Impending Demise of the Great Barrier Reef a “Fairy Tale”