Contribution of Low Clouds to Global Warming Still Controversial
/A slew of research papers over the last year have attributed the so far unexplained surge in recent global warming to a decline in low cloud cover. But such a connection is still controversial. Several of the papers question their own conclusions or employ dubious methodology.
Prominent among these publications is a 2025 study by a trio of German environmental scientists. From satellite data, the authors claim to have pinpointed record-low planetary albedo, caused by a reduction in low clouds, as the primary source of the recent global temperature surge. The lowered albedo is most prominent in northern mid-latitudes and the tropics.
Albedo is a measure of the earth’s ability to reflect incoming solar radiation. Melting of light-colored snow and sea ice due to warming exposes darker surfaces such as soil, rock and seawater, which have lower albedo. The less reflective surfaces absorb more of the sun’s radiation and thus push temperatures higher.
The same effect occurs with low-level clouds, which are the majority of the planet’s cloud cover. Low-level clouds such as cumulus and stratus clouds are thick enough to reflect 30-60% of the sun’s radiation that strikes them back into space, so they act like a parasol and normally cool the earth’s surface. But less cloud cover lowers albedo and therefore results in warming.
The figure below shows global total and low cloud cover since 2000, calculated by the study authors from two separate sets of satellite data, indicated by the red and black curves, respectively. The decline in low cloud cover is as much as 1.5% – small, but large enough to raise global temperatures by 0.22 degrees Celsius (0.40 degrees Fahrenheit), say the scientists.

Furthermore, the disappearance of low clouds due to global warming sets up a positive feedback loop since fewer clouds cause more warming, which in turn lowers cloud cover even more. Nevertheless, the study authors cast doubt on their conclusions by pointing out that it is difficult to disentangle low cloud feedback from internal variability of the climate system and indirect aerosol effects. Long-term natural variability is associated with ocean cycles such as the AMO (Atlantic Multidecadal Oscillation).
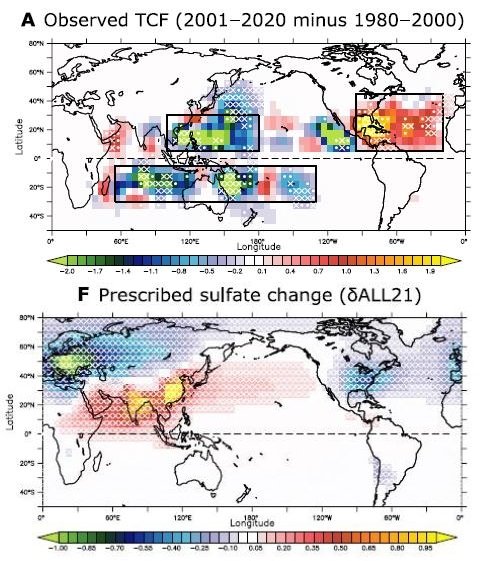
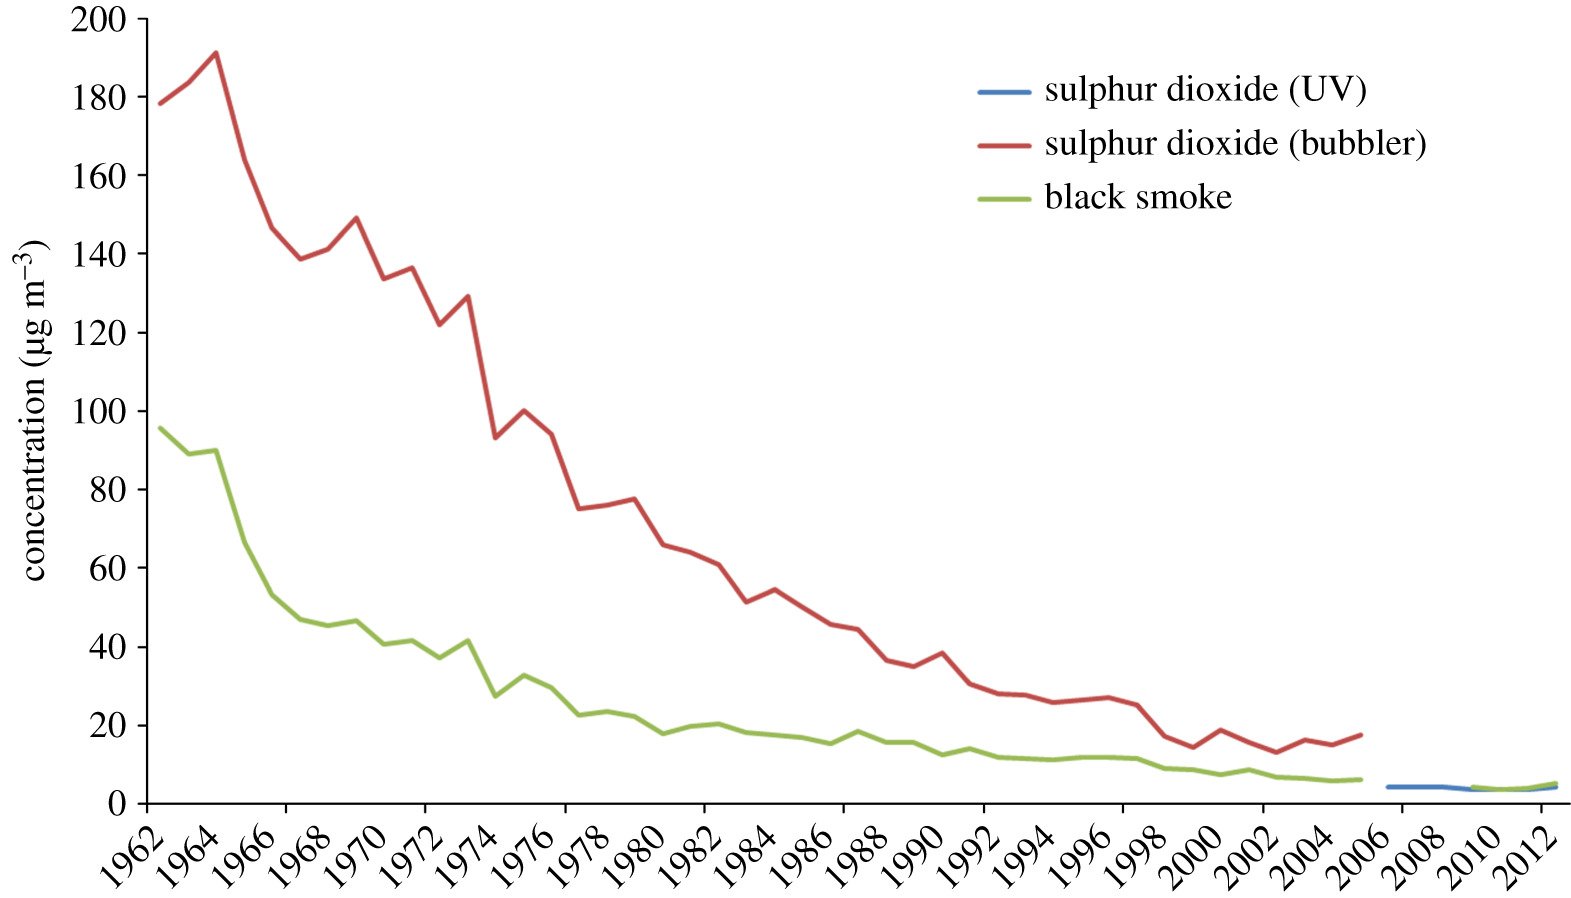
As I discussed in a 2024 post, a major reduction in emissions of SO2 (sulfur dioxide) since 2020, arising from a ban on the use of high-sulfur fuels by ships, can boost global warming. SO2 reacts with water vapor in the air to produce sulfate aerosol particles that linger in the atmosphere and reflect incoming sunlight; they also act as condensation nuclei for the formation of reflective clouds. So the reduction in shipping emissions also contributes to the decline in low cloud cover.
More data linking the decline in low cloud cover to global warming is depicted in the next figure, showing cloud cover calculated from a different set of satellite data, and temperatures in degrees Celsius relative to the mean tropospheric temperature from 1991 to 2020.

A second 2025 paper, by two Chinese environmental engineers and a U.S. scientist, maintains that tropical low cloud feedback is positive rather than negative and 71% stronger than previously thought. Their conclusion depends on use of an obscure mathematical technique known as Pareto optimization, to reconcile large positive cloud feedback for the Atlantic Ocean in some global climate models with negative feedback for the Pacific in other models.
However, these authors concede that if warming is more uniform between cold stratocumulus regions and warm cloud ascent areas than they have assumed, then tropical low cloud feedback is likely to be much lower or even negative.
In a 2023 post, I reported on empirical observations, made by a team of French and German scientists, that refute the notion of positive low cloud feedback and show that the mechanism causing the strongest cloud reductions due to warming in climate models doesn’t actually occur in nature. Their conclusions were based on collection and analysis of observational data from cumulus clouds near the Atlantic island of Barbados.
In climate models, the refuted mechanism leads to strong positive cloud feedback that amplifies global warming. The models find that low clouds would thin out, and many would not form at all, in a hotter world. But the research team’s analysis reveals that climate models with large positive feedbacks are implausible.
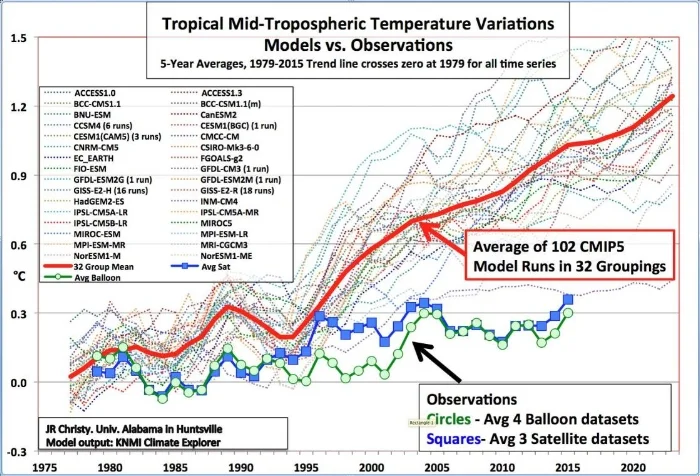
Weaker than expected low cloud feedback is also suggested by lack of the so-called CO2 “hot spot” in the atmosphere, as I discussed in a 2021 post. Climate models predict that the warming rate at altitudes of 9 to 12 km (6 to 7 miles) above the tropics should be about twice as large as at ground level. Yet the hot spot doesn’t show up in measurements made by weather balloons or satellites.
Next: Update: No Grand Solar Minimum Likely Anytime Soon