
Australian Bushfires: Ample Evidence That Past Fires Were Worse
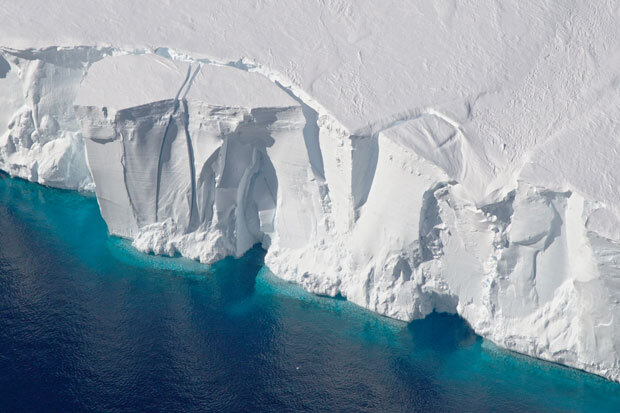
/Listening to Hollywood celebrities and the mainstream media, you’d think the current epidemic of bushfires in Australia means the apocalypse is upon us. With vast tracts of land burned to the ground, dozens of people and millions of wild animals killed, and thousands of homes destroyed, climate alarmists would have you believe it’s all because of global warming.
But not only is there no scientific evidence that the frequency or severity of wildfires are on the rise in a warming world, but the evidence also clearly shows that the present Australian outbreak is unexceptional.

Although almost 20 million hectares (50 million acres, or 77,000 square miles) nationwide have burned so far, this is less than 17% of the staggeringly large area incinerated in the 1974-75 bushfire season and less than the burned area in three other conflagrations. Politically correct believers in the narrative of human-caused climate change seem unaware of such basic facts about the past.
The catastrophic fires in the 1974-75 season consumed 117 million hectares (300 million acres), which is 15% of the land area of the whole continent. Because nearly two thirds of the burned area was in remote parts of the Northern Territory and Western Australia, relatively little human loss was incurred, though livestock and native animals such as lizards and red kangaroos suffered.
The Northern Territory was also the location of major bushfires in the 1968-69, 1969-70 and 2002-03 seasons that burned areas of 40 million, 45 million and 38 million hectares (99 million, 110 million and 94 million acres), respectively. That climate change wasn’t the cause should be obvious from the fact that the 1968-69 and 1969-70 fires occurred during a 30-year period of global cooling from 1940 to 1970.
Despite the ignorance and politically charged rhetoric of alarmists, the primary cause of all these terrible fires in Australia has been the lack of intentional or prescribed burning. The practice was used by the native Aboriginal population for as long as 50,000 years before early settlers abandoned it after trying unsuccessfully to copy indigenous fire techniques – lighting fires so hot that flammable undergrowth, the main target of prescribed burns, actually germinated more after burning.
The Aboriginals, like native people everywhere, had a deep knowledge of the land. They knew what types of fires to burn for different types of terrain, how long to burn, and how frequently. This knowledge enabled them to keep potential wildfire fuel such as undergrowth and certain grasses in check, thereby avoiding the more intense and devastating bushfires of the modern era. As the Aboriginals found, small-scale fires can be a natural part of forest ecology.
Only recently has the idea of controlled burning been revived in Australia and the U.S., though the approach has been practiced in Europe for many years. Direct evidence of the efficacy of controlled burning is presented in the figure below, which shows how bushfires in Western Australia expanded significantly as prescribed burning was suppressed over the 50 years from 1963 to 2013.

Bushfires have always been a feature of life in Australia. One of the earliest recorded outbreaks was the so-called Black Thursday bushfires of 1851, when then record-high temperatures up to 47.2 degrees Celsius (117 degrees Fahrenheit) and strong winds exacerbated fires that burned 5 million hectares (12 million acres), killed 12 people and terrified the young colony of Victoria. The deadliest fires of all time were the Black Saturday bushfires of 2009, also in Victoria, with 173 fatalities.
Pictures of charred koala bears, homes engulfed in towering flames and residents seeking refuge on beaches are disturbing. But there’s simply no evidence for the recent statement in Time magazine by Malcolm Turnbull, former Australian Prime Minister, that “Australia’s fires this summer – unprecedented in the scale of their destruction – are the ferocious but inevitable reality of global warming.” Turnbull and climate alarmists should know better than to blame wildfires on this popular but erroneous belief.
Next: The Futility of Action to Combat Climate Change: (1) Scientific and Engineering Reality


