
El Niño and La Niña May Have Their Origins on the Sea Floor
/One of the least understood aspects of our climate is the ENSO (El Niño – Southern Oscillation) ocean cycle, whose familiar El Niño (warm) and La Niña (cool) events cause drastic fluctuations in global temperature, along with often catastrophic weather in tropical regions of the Pacific and delayed effects elsewhere. A recent research paper attributes the phenomenon to tectonic and seismic activity under the oceans.
Principal author Valentina Zharkova, formerly at the UK’s Northumbria University, is a prolific researcher into natural sources of global warming, such as the sun’s internal magnetic field and the effect of solar activity on the earth’s ozone layer. Most of her studies involve sophisticated mathematical analysis and her latest paper is no exception.
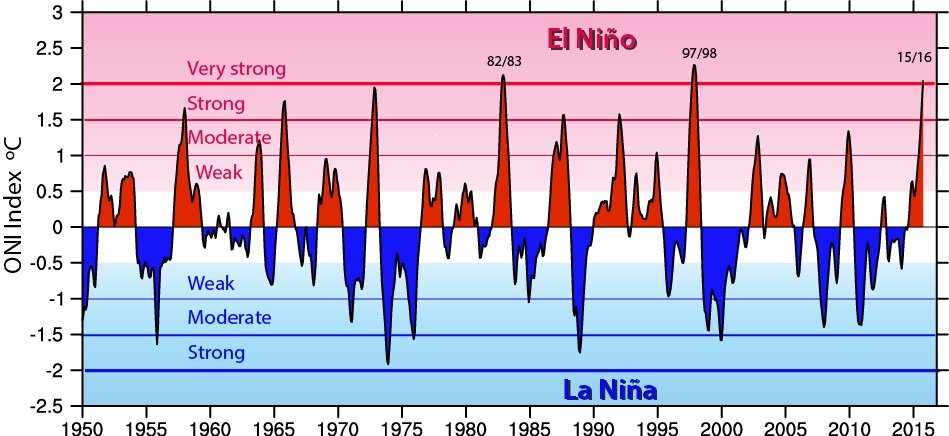
Zharkova and her coauthor Irina Vasilieva make use of a technique known as wavelet analysis, combined with correlation analysis, to identify key time periods in the ONI (Oceanic Niño Index). The index, which measures the strength of El Niño and La Niña events, is the 3-monthly average difference from the long-term average sea surface temperature in the ENSO region of the tropical Pacific. Shown in the figure below are values of the index from 1950 to 2016.
Wavelet analysis supplies information both on which frequencies are present in a time series signal, and on when those frequencies occur, unlike a Fourier transform which decomposes a signal only into its frequency components.
Using the wavelet approach, Zharkova and Vasilieva have identified two separate ENSO cycles: one with a shorter period of 4-5 years, and a longer one with a period of 12 years. This is illustrated in the next figure which shows the ONI at top left; the wavelet spectrum of the index at bottom left, with the wavelet “power” indicated by the colored bar at top right; and the global wavelet spectrum at bottom right.
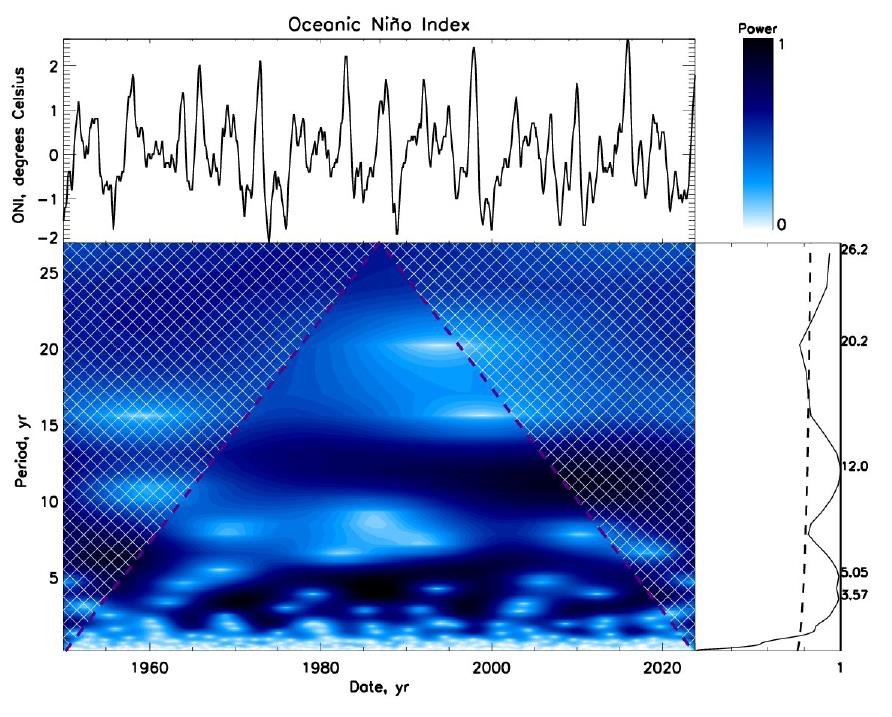
The authors link the 4- to 5-year ENSO cycle to the motion of tectonic plates, a connection that has been made by other researchers. The 12-year ENSO cycle identified by their wavelet analysis they attribute to underwater volcanic activity; it does not correspond to any solar cycle or other known natural source of warming.
The following figure depicts an index (in red, right-hand scale), calculated by the authors, that measures the total annual volcanic strength and duration of all submarine volcanic eruptions from 1950 to 2023, superimposed on the ONI (in black) over the same period. A weak correlation can be seen between the ENSO ONI and undersea volcanic activity, the correlation being strongest at 12-year intervals.
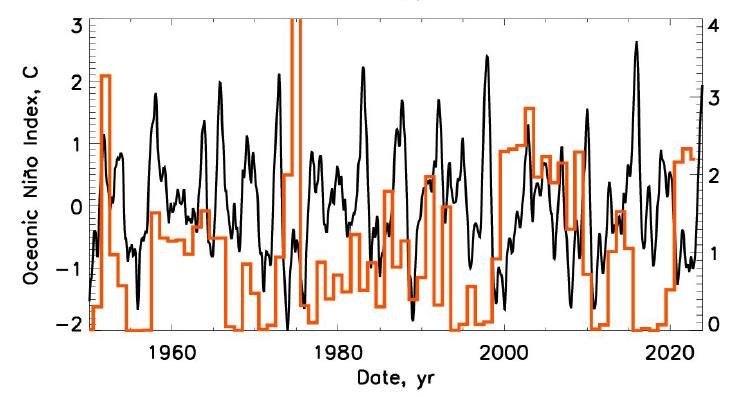
Zharkova and Vasilieva estimate the 12-year ENSO correlation coefficient at 25%, a connection they label as “rather significant.” As I discussed in a recent post, retired physical geographer Arthur Viterito has proposed that submarine volcanic activity is the principal driver of global warming, via a strengthening of the thermohaline circulation that redistributes seawater and heat around the globe.
Zharkova and Vasilieva, however, link the volcanic eruptions causing the 12-year boost in the ENSO index to tidal gravitational forces on the earth from the giant planet Jupiter and from the sun. Jupiter of course orbits the sun and spins on an axis, just like Earth. But the sun is not motionless either: it too rotates on an axis and, because it’s tugged by the gravitational pull of the Jupiter and Saturn giants, orbits in a small but complex spiral around the center of the solar system.
Jupiter was selected by the researchers because its orbital period is 12 years - the same as the longer ENSO cycle identified by their wavelet analysis.
That Jupiter’s gravitational pull on Earth influences volcanic activity is clear from the next figure, in which the frequency of all terrestrial volcanic eruptions (underwater and surface) is plotted against the distance of Earth from Jupiter; the distance is measured in AU (astronomical units), where 1 AU is the average earth-sun distance. The thick blue line is for all eruptions, while the thick yellow line shows the eruption frequency in just the ENSO region.

What stands out is the increased volcanic frequency when Jupiter is at one of two different distances from Earth: 4.5 AU and 6 AU. The distance of 4.5 AU is Jupiter’s closest approach to Earth, while 6 AU is Jupiter’s distance when the sun is closest to Earth and located between Earth and Jupiter. The correlation coefficient between the 12-year ENSO cycle and the Earth-Jupiter distance is 12%.
For the gravitational pull of the sun, Zharkova and Vasilieva find there is a 15% correlation between the 12-year ENSO cycle and the Earth-sun distance in January, when Earth’s southern hemisphere (where ENSO occurs) is closest to the sun. Although these solar system correlations are weak, Zharkova and Vasilieva say they are high considering the vast distances involved.
Next: Shrinking Cloud Cover: Cause or Effect of Global Warming?


