New Projections of Sea Level Rise Are Overblown
/That sea levels are rising due to global warming is not in question. But there’s no strong scientific evidence that the rate of rise is accelerating, as claimed in a recent NOAA (the U.S. National Oceanic and Atmospheric Administration) report on sea level rise or the Sixth Assessment Report (AR6) of the UN’s IPCC (Intergovernmental Panel on Climate Change). Such claims create unnecessary alarm.
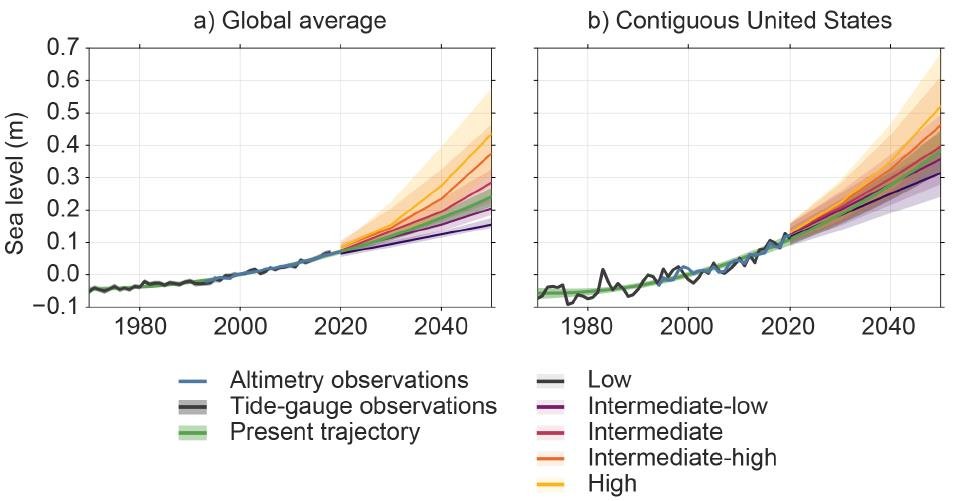
NOAA’s projections to 2050 are illustrated in the next figure, showing sea level relative to 2000 both globally and in the contiguous U.S. The green curves represent a smoothing of actual observations from 1970 to 2020, together with an extrapolation from 2020 to 2050 based on the earlier observations. The projections in other colors correspond to five different modeled scenarios ranging from low to high risk for coastal communities.
The U.S. projections are higher than the global average because the North American Atlantic coast is a “hotspot” for sea level rise, with anomalously high rates of rise. The extrapolated U.S. average is projected to increase from 11 cm (4.3 inches) above its 2000 level in 2020, to 19 cm (7.5 inches) in 2030, 28 cm (11 inches) in 2040 and 38 cm (15 inches) in 2050. Projected increases are somewhat higher than average for the Atlantic and Gulf coasts, and considerably lower for the west coast.
These projected NOAA increases clearly suggest an accelerating rate of sea level rise, from a rate of 5.5 cm (2.2 inches) per decade between 2000 and 2020, to an almost doubled 10 cm (3.9 inches) per decade between 2040 and 2050. That’s an acceleration rate of 0.15 mm per year per year and implies a rise in U.S. sea levels by 2050 as large as that seen over the past century. The implied global acceleration rate is 0.08 mm per year per year.
But even the IPCC’s AR6, which makes some exaggerated claims about extreme weather, estimates global sea level acceleration at only 0.1 mm per year per year from 1993 to 2018. It seems highly unlikely that the rate would increase by 50% in 32 years, so the NOAA projections appear excessively high.
However, all these estimates are based not only on actual measurements, but also on computer models. The models include contributions to sea level rise from the expansion of seawater as it warms; melting of the Greenland and Antarctic ice sheets, as well as glaciers; sinking of the seafloor under the weight of extra meltwater; and local subsidence due to groundwater depletion, or rebound after melting of the last ice age’s heavy ice sheet.
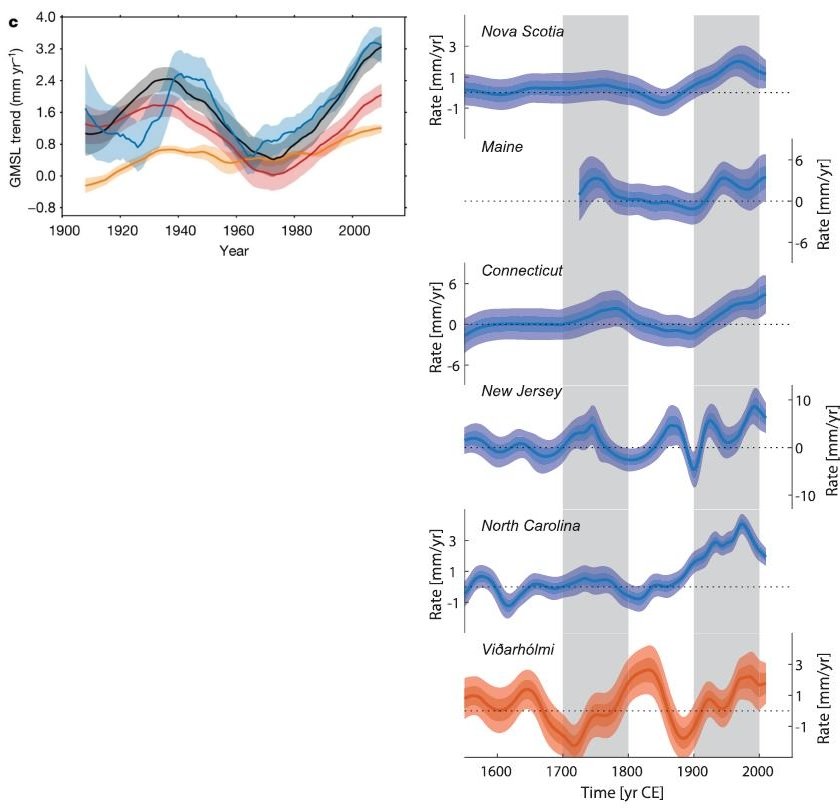
The figure on the left below shows the GMSL (global-mean sea level, blue curve) rise rate estimated by one of the models for the 100 years from 1910 to 2010. Although it’s clear that the rate has been increasing since the late 1960s, it did the same in the 1920s and 1930s, and may currently be turning downward. Not surprisingly, studies using these models often come to very different conclusions about future rates of sea level rise.
The figure on the right below is an historical reconstruction of the rise rate for various locations along the Atlantic North American and Icelandic coasts, derived from salt-marsh sediment proxies and corrected for glacial rebound. It can be seen that rates of rise in the 18th century were at times only slightly lower than those in the 20th century, and that sea levels have fluctuated for at least 300 years, long before modern global warming began.
Because of this, the reconstruction study authors comment that the high “hotspot” rates of sea level rise in eastern North America may not be associated with any human contribution to global warming. They hypothesize that the fluctuations are related to changes in the mass of Arctic land ice, possibly associated with the naturally occurring North Atlantic Oscillation.
Along with the IPCC estimates, the reconstruction casts doubt on NOAA’s claim of continuing acceleration of today’s sea level rise rate. An accompanying news release adds to the hype, stating that “Sea levels are continuing to rise at an alarming rate, endangering communities around the world.”
Supporting the conclusion that NOAA’s projections are exaggerated is a 2021 assessment by climate scientist Judith Curry of projected sea level scenarios for the New Jersey coast. Taking issue with a 2019 report led by scientists from Rutgers University, her assessment found that the Rutgers sea level projections were – like NOAA’s estimates – substantially higher than those of the IPCC in its Fifth Assessment Report prior to AR6. Curry’s finding was that the bottom of the Rutgers “likely” scenarios was the most probable indicator of New Jersey sea level rise by 2050.
Interestingly, NOAA’s “low” scenario projected a U.S. average sea level of 31 cm (12 inches) in 2050, rather than 38 cm (15 inches), implying essentially no acceleration of the rise rate at all – and no cause for its media hype.
(This post has also been kindly reproduced in full on the Climate Depot blog.)
Next: Natural Sources of Global Warming and Cooling: (2) The PDO and AMO


